SHEN Yuhu and his team researched 255 six-rowed barley (Hordeum vulgare L. ssp. Vulgare) landraces from the Qinghai-Tibetan Plateau using 1264 polymorphic diversity array technology (DArT) markers, and the analysis involved The genetic diversity, population structure, and extent of linkage disequilibrium (LD) .
The results supported that six-rowed barley landraces from this region are divided into five distinct subpopulations centered on the regions of origin of the germplasm.
The genetic distances calculated for all the individual pairs were geographically dependent, as revealed by Mantel tests (r = 0.35, P < 0.001) and spatial autocorrelation analysis. The LD values, expressed as r2, declined with increasing genetic distance, and the same tendency occurred on each chromosome. In general, LD values were low (9.1% of adjacent markers; P < 0.001), and mean LD values across the whole genome decayed to below the critical r2 of 0.22 after 3.32 cM. Approximately 19.0% of marker pairs (mean r2 = 0.586) located on the same chromosome and 4.9% of pairs (mean r2 = 0.318) located on different chromosomes were in LD (r2 ≥ 0.22).
The results discerned relevant patterns of genetic diversity, population structure, and LD among members of a Qinghai-Tibet Plateau barley landraces panel proposed to be ‘typical’ of a target region or environment and have important implications for further studies on association mapping and practical breeding in high-altitude naked barley.
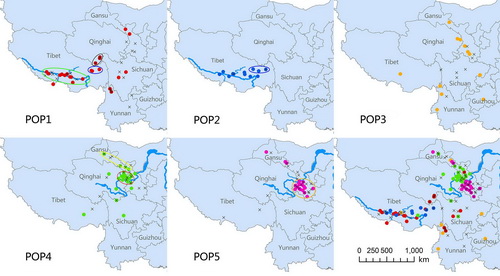
Figure. Geographical distributions of barley landrace populations from the Qinghai-Tibetan Plateau at the optimal population number K = 5. The locations of the individual landraces are indicated and the circles represent the geographical regions listed in the text. The locations of those landraces with a proportional population membership of ≥0.8 and <0.8 are indicated by different colors and x, respectively. These are consistent with the STRUCTURE and principal coordinate analysis (Fig. 1 and 3). Green circle: the area along the Yarlung Zangbo River and its two tributaries; black circle: south Qinghai Province (the Yushu Tibetan Autonomous Prefecture); blue circle: the Changdu region; red circle: the Hehuang Valley; yellow circle: the Hexi Corridor Region; orange circle: south Gansu Province (the Gannan region).
Additional Information:
1 Author Information: Lei Wang, Jinqing Xu, Tengfei Xia, Huaigang Zhang, Dengcai Liu, Yuhu Shen.
Correspondence: shenyuhu@nwipb.cas.cn; dcliu7@yahoo.com
2 Published: Crop science.2014,54(5):2011-2022.